The data modeling tools are used to define virtual semantic analytical data models to instruct the tools how to query the database. Unlike the Data Flow, which is used to construct a database and schema, the configurations set in the Data Model are executed at runtime.
Data Model Tethering and Reusability
The data model is not stored in the underlying database. It is a separate virtual construct that exists in Pyramid. As such, a given database can have multiple semantic models, while a given semantic model can be re-pointed to another database.
Users build analytic content against these models, which are not specific to any given report, formula, dashboard, publication or infographic. Access to the model is governed by security. Access to the underlying database is also governed by security (users need both). Once a user has access, they can build whatever content they like on that data model. The content is shared with other users, they will need to have the appropriate rights to the model and the underlying data source as well.
Data Model Interface
The data modeling tools consist of four main panels: Configuration, Tables, Columns, and Hierarchy. Each panel exposes a ribbon that provides access to a range of functions for that panel.
- Click here to learn about the Data Model ribbons.
Configuration
The Configuration panel shows basic information about the data model and the ETL. You can see and edit model metadata, like the model name, description, and default measure.
You can also see information about the ETL, including the Data Flow name and the destination database.
Lastly, you'll see a summary showing the number of tables, columns, and measures in the new data model.
- Click here to learn more about the configuration panel.
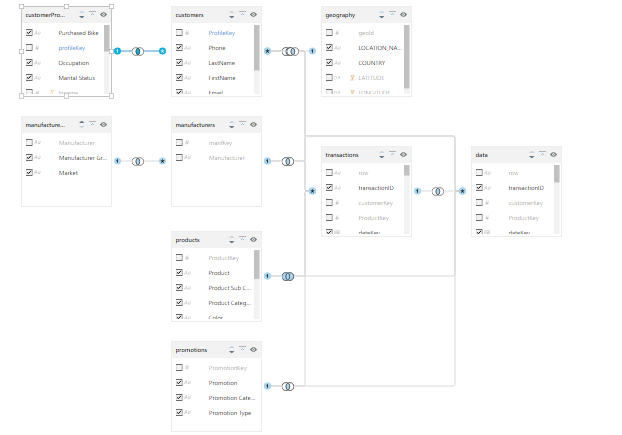
Tables
The Tables panel displays a graphical representation of the model's tables and the relationships between the tables. Each table is represented as a tile widget, which can be moved, collapsed and expanded. Each table widget lists all the columns within that table.
From the Tables panel, you can edit relationships, columns, and measures.
- Click here to learn more about the Tables panel.
Columns
Column visibility and metadata can be managed from both the Tables panel and the Columns panel. The Columns panel presents a tabular listing of tables and columns, as opposed to the graphical representation shown in the Tables panel. Whether you choose to manage column visibility and metadata from the Tables or Columns panel will largely depend on personal preference.
The Columns panel is also used to sort the model's Columns, which cannot be done from the Tables panel.
- Click here to learn more about the Columns panel.
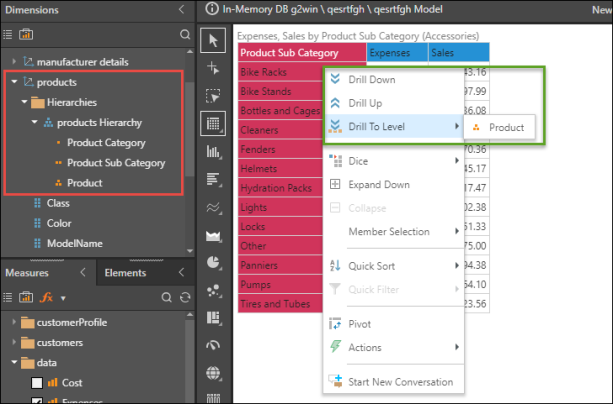
Hierarchy
Hierarchies are tree-structures made up of multiple columns arranged into a hierarchical order, enabling end users to traverse multiple columns (levels) from one visualization.
Hierarchies are constructed from the Hierarchy panel, by adding the required columns from a table. The panel displays visible table in the model; each table can be expanded to view its columns.
A hierarchy is built by adding several columns from a single table, in the logical hierarchical order.
- Click here to learn more about the Hierarchy panel.
Translations
Translations provides the capability to create various language models, facilitating the development of multi-language reports and dashboards. For instance, users can design a report that dynamically displays content in English, French, or Italian based on the user's language preference. Language definitions must be made for both metadata (tables, columns, measures, hierarchies, etc) and attributes (data). The metadata definitions must be manually entered, while the attribute definitions for the multiple languages must be stored in translation attributes in the data source. The attribute interface allows users to map the translation attributes to the original data tables.
- Click here to learn more about the Translations panel.